
METHODOLOGY FOR F&G
|
Client: M/s _ _ _ _ _ _ _ _ Title:METHODOLOGY FOR F&G |
|||||
|
|
|||||
|
05/04/2023 |
A |
Final |
MK |
RB |
|
|
Date |
Rev |
Remarks / Revision Summary |
Prepared |
Checked |
Approved |
|
HSE RMSPL |
|||||
|
REVISION RECORDS |
DISCLAIMER
This methodology has been prepared on behalf of and for the exclusive use of M/s _KUDOS CHEMI LTD (UPL LIMITED) and is subject to and issued in accordance with the contract between M/s _KUDOS CHEMI LTD (UPL LIMITED)and HSE Risk Management Services Private Limited. HSE Risk Management Services Private Limited accepts no liability or responsibility whatsoever for it in respect of any use of or reliance upon this Methodology by any third party.
Copying this Methodology without the permission of M/s _KUDOS CHEMI LTD (UPL LIMITED) or HSE Risk Management Services Private Limited is not permitted.
- F&G Study Methodology
This 3D fire and gas mapping study shall be carried out based on the approved Fire and Gas Detector 3D Mapping Assumption Register. The methodology is presented below.
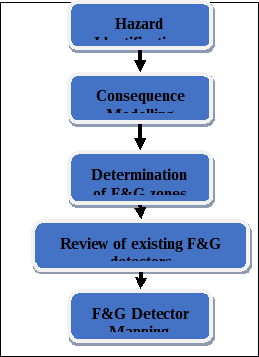
Figure 1: Fire and Gas Detector Mapping Study Methodology
The above methodology is described below
Hazard Identification: For the collection of data. Identification of scenarios based upon detailed review of project documents (PFD, P&ID, and Plot Plans etc.). Scenario identification also includes identification of Hazardous Materials in the project facility.
Consequence Modelling: Conduct consequence assessment to determine the dispersion of flammable gas (25 % LFL and 50 % LFL), fire scenarios (jet/pool fire) radiation distances (12.5 kW/m2) and toxic distances (10 ppm and 20 ppm), actual assessment criteria can be finalized based on mutual agreement with client.
Determination of F&G zones: In line with the existing F&G zones, F&G mapping study will be conducted.
F&G Detector Mapping: Conduct Fire and Gas detector mapping taking into consideration the consequence results, adequacy of existing fire and gas detectors on overall Fire and Gas detectors layout provided.
- Limitation of 3D F&G Mapping
As agreed by the Company and Consultant, this study is conducted using 3D F&G detection mapping and following are the limitations:
- The zone wise percentage detector coverage cannot be determined using 3D F&G Model.
- Unlike 3D F&G mapping, coordinates of detectors cannot be determined in 3D F&G mapping.
- Azimuth and declination can be determined for Flame Detector only in 3D F&G mapping. They cannot be determined in 3D F&G mapping.
- Voting degradation cannot be determined.
- The performance requirements of the F&G detectors cannot be determined.
- Optimization is carried out based on engineering judgment only